If you choose one of Scala Hosting’s managed VPS hosting packages for your online project, you won’t need to worry about other users on the same server consuming too many resources and ruining your website’s performance. You’ll have a predetermined amount of CPU power, RAM, and storage space that is guaranteed and at your disposal at any time. Meanwhile, because you’ve gone for one of the managed plans, you won’t need to worry about setting up and maintaining the actual server.
Technical jobs like creating the server, installing the operating system, and configuring it are our responsibility, and you can focus on creating an SPanel admin account and start working on your websites.
That being said, you are still in control of your VPS, and you need to be aware of how well it’s coping with your projects to ensure their performance is up to scratch.
To help you with that, SPanel’s Admin Interface has a few sections that let you check the status of your VPS and take the necessary steps in case something’s not quite right.
Checking your VPS’ server status through SPanel’s Admin Interface
All the information you need is easily accessible from SPanel’s Admin Interface. By default, the login URL is https://[your server name]/spanel/, and after you successfully sign in, you will see three widgets at the very top of the home page informing you about the current CPU load, RAM and disk space usage.

If the values are too high – you might want to take appropriate action. Before you do, however, it pays to see some more insights from the Admin Interface.
The Server Information page is available in the menu on the left, and it contains all sorts of data about your VPS. For the sake of better organization, it’s broken down into several sections:
- The System Information section holds data on the operating system, kernel version, and architecture your VPS runs on.
- The Processor Information section gives you the number of CPU cores, the vendor, the processor’s speed, and its cache size.
- The Current Memory Usage contains information on the amount of available physical and swap memory as well as current statistics on how much of it is being used.
- The Current Disk Usage can tell you how much storage space you’ve got and how much of it is free at the moment.
Information on the status of your VPS is also available on the Server Status page, which, for your convenience, can also be accessed from the Quick Links section on SPanel’s homepage. On it, you can see a full list of the services running on your VPS, including your web server, the SShield security system, and your FTP and email services.
Most likely, there will be a green checkmark next to each service, indicating that it’s running smoothly. If this isn’t the case, you can try to rectify the problem by restarting the server from the Restart Service page available from the menu on the left.

The green checkmarks should also be visible further down on the Server Status page. There, you can once again find information on the load your VPS is experiencing. A list of currently running SQL queries is available on the Show MySQL Running Queries page from the menu on the left.
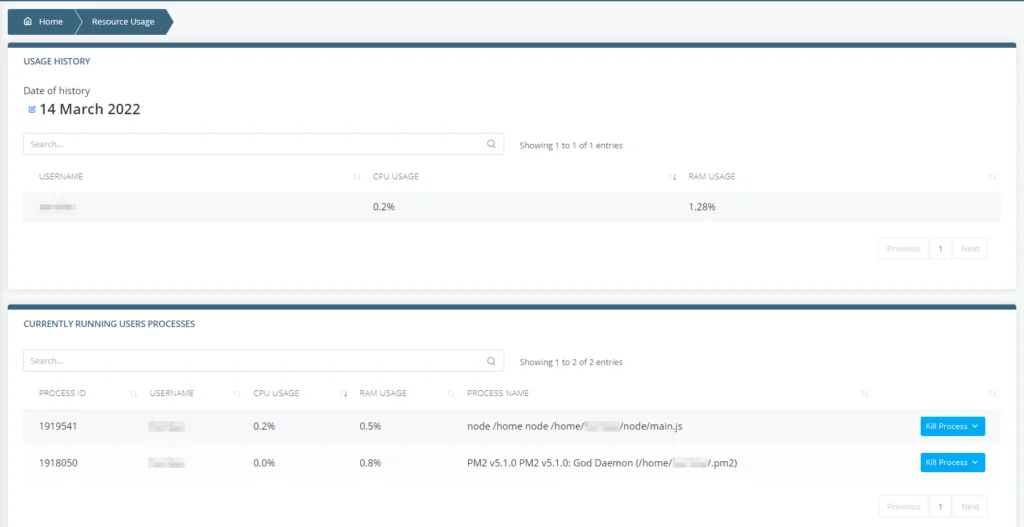
Last but not least, you can get detailed usage statistics from the Resource Usage page. You can see day-by-day data on which accounts and processes are putting the most load on your VPS, and you can take the appropriate actions.

If you feel that the server isn’t performing as well as it should be, you can either restart it through the SPanel Admin Interface or simply contact our technical support team to identify the problem and help you fix it.
How to Check my Server Status