
SPanel includes a per-account PHP-FPM slow log that you can enable from Tools > PHP Manager, with no SSH or root access needed. You set a threshold in seconds, and any PHP request that runs longer has its call stack recorded to a private per-user log. The one thing to plan around: the slow log auto-disables after 24 hours, so it is a short diagnostic window, not a permanent setting. Enable it, reproduce the slow page, then read what it captured.
Who this is for
This is for developers and site owners who can see that a page is slow but cannot tell which PHP request is causing it, working from the SPanel User Interface without root or shell access. If you run a WordPress or custom PHP site, this is the built-in way to find the script eating the seconds.
What problem this solves
A page “feels slow” tells you nothing about where the time goes, so without a way to see inside PHP you end up guessing – disabling plugins at random, or blaming the database. The slow log answers a narrower question: which requests crossed a time limit you chose, and what they were doing in PHP at that point. That turns a vague complaint into a specific script and call stack you can act on.
How SPanel solves this
Open PHP Manager from SPanel’s User Interface. SPanel lists each domain in its own row, and every row has an Actions menu. Open it and select PHP Slow Log.
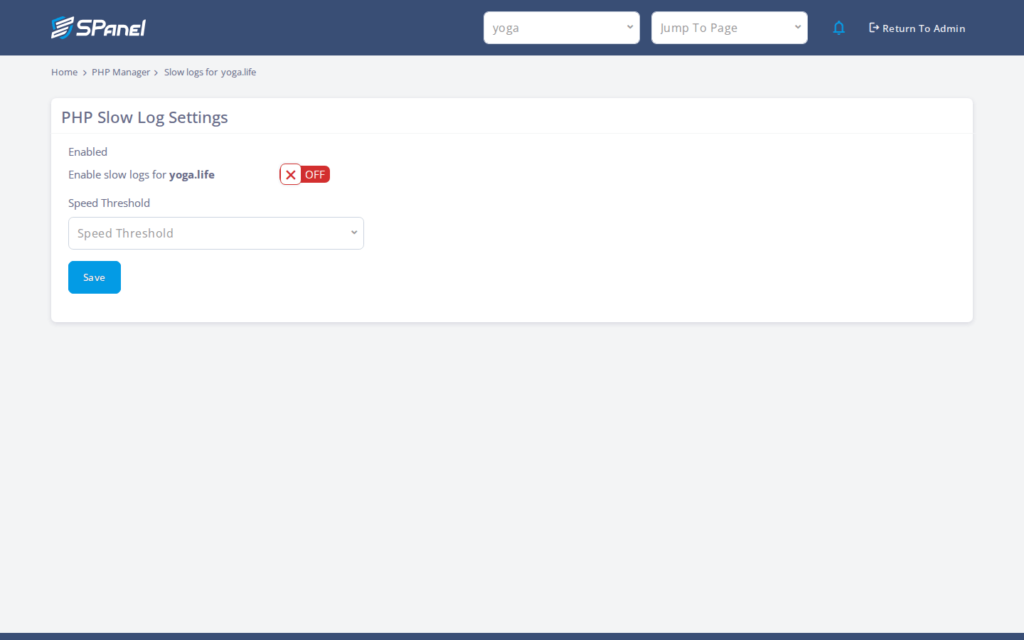
On the page you enable the slow log and set a threshold – the speed, in seconds. Any request slower than that value is logged. Behind the scenes your threshold becomes the PHP-FPM request_slowlog_timeout. Set the number, reproduce the slow page, then read the entries it collected.
Why this is different in SPanel
Two things stand out. First, it is a one-click, time-boxed diagnostic scoped to one account: you set the threshold, SPanel handles the PHP-FPM configuration, then switches the log off after 24 hours so a forgotten debug setting never lingers in production. Second, the output stays private – written to a per-user path, reached entirely from the SPanel UI, with no SSH, no root, and no shared log other accounts can read.
Before you start
- Access to the SPanel User Interface for the account that owns the domain is required.
- Think of a suitable threshold you want to set.
- A way to reproduce the slow page yourself – the log only fills when a slow request runs.
- Awareness of the 24-hour window: plan to enable, reproduce, and read in one sitting.
Step-by-step
- In SPanel, open PHP Manager. You should see each domain on the account in its own row.
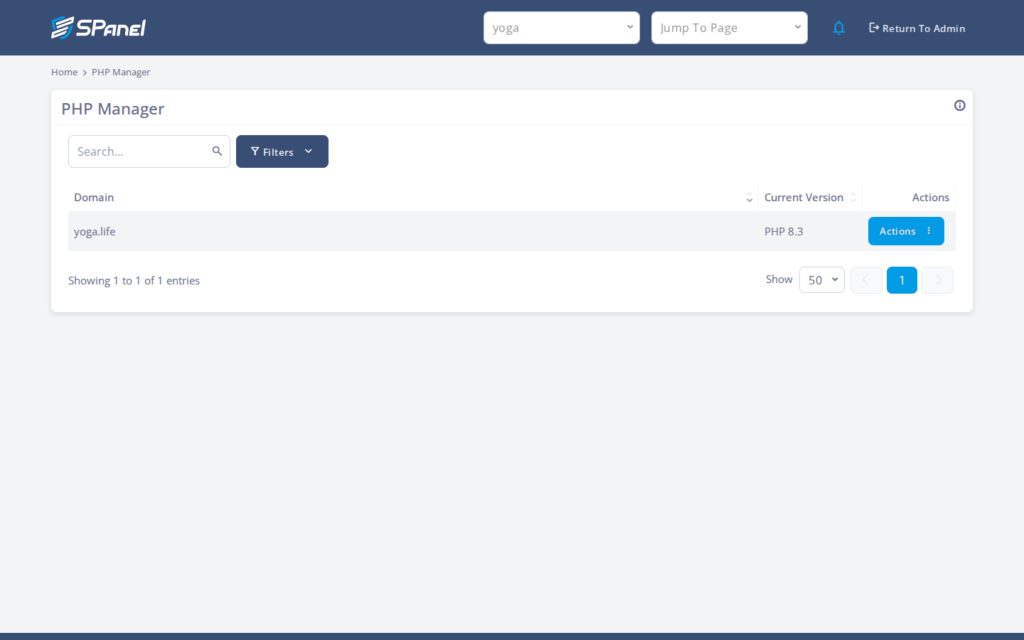
- Find the domain you want to diagnose – in our example, yoga.life – and open its Actions menu.
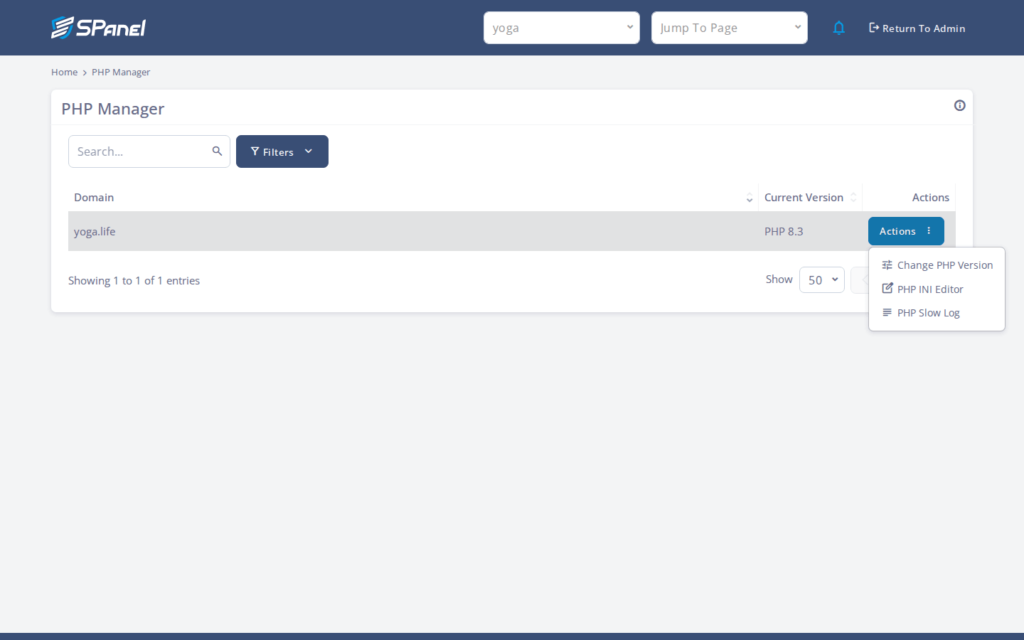
- Click PHP Slow Log to open the slow log page for that domain. Enable the log and set the threshold using the drop-down. The threshold can be between 1 and 10 seconds. Click Save.
- Reproduce the slow page in your browser. Load the slow URL a few times so a request actually crosses your threshold.
- Return to the slow log page and read the captured entries. Each shows the PHP call stack of a request that ran past your threshold, pointing you at the script and function that were running.
What happens behind the scenes
Your threshold becomes the PHP-FPM request_slowlog_timeout. When a request runs longer, PHP-FPM dumps its call stack into the log. SPanel writes that to /var/spanel/userdata/<user>/slow-php.log, a path scoped to your account – which is why no SSH access is required and other accounts cannot see your entries. The same automation turns the setting back off after 24 hours.
Limitations and edge cases
- It auto-disables after 24 hours. This is a time-boxed diagnostic, not a permanent setting. For an intermittent problem, re-enable it for another window rather than expecting it to stay on.
- It only records requests slower than your threshold. Set the value too high and a moderately slow page never gets logged. If the log is empty, lower the threshold and reproduce again.
- It captures the PHP call stack, not a full trace. You get the stack of the slow request, not a line-by-line profile or query timings. Use it to find the slow script, then dig in with your own tooling.
Troubleshooting
| Symptom | Likely cause | What to do |
| Log stays empty after reproducing | Threshold higher than the request’s actual time | Lower the threshold and load the slow page again |
| Log worked, now records nothing | The 24-hour window expired and it auto-disabled | Re-enable the slow log and reproduce |
| Stack shown but no clear cause | Slow log captures the call stack only | Use the named script as a starting point for deeper profiling |
When to use this / when not to use this
| Use this when | Skip or use something else when |
| You need to find which PHP request is slow without SSH | You need continuous, always-on monitoring |
| You can reproduce the slow page on demand | The slowness is in the database or network, not PHP |
| You want a quick, account-scoped diagnostic | You need a full line-by-line profile |
FAQ
Q: Do I need SSH or root access to use the slow log?
A: No. You enable and read it entirely from the SPanel User Interface under Tools > PHP Manager, and the log is written to a per-user path.
Q: Why is my slow log empty?
A: Usually the threshold is higher than the request’s actual run time, so nothing qualifies. Lower it and reproduce the page; it only records requests slower than the value you set.
Q: How long does the slow log stay enabled?
A: It auto-disables after 24 hours. Enable it, capture the problem, and read the results in the same session.
Q: What threshold should I set?
A: A few seconds is a reasonable start for a page that feels slow. Set it lower if you suspect a moderately slow request rather than a stuck one.
Q: Does the slow log show database query times?
A: No. It captures the PHP call stack of the slow request, not query timings or a full trace. Use it to identify the script, then profile the database on its own.
Q: Can other accounts see my slow log?
A: No. The log lives at a per-user path tied to your account, and you reach it only through your own SPanel session.
