

ON THIS PAGE
SPanel includes built-in website monitoring under Domains > Website Monitoring, so you can track whether a hosted site is up, how fast it responds, and its SSL status without a separate uptime service. You enable it per domain from the monitoring settings page, and alerts reach you through SPanel’s Notifications Manager. Detection runs on a polling cadence, so notices are near-real-time rather than instant, and alerts only fire if you have a notification channel configured.
Who this is for
This is for site owners and the people running a ScalaHosting managed VPS who want to know quickly when a hosted site goes down or slows. If you rely on a customer email to tell you the site is offline, or pay a third-party uptime checker for one domain, the built-in tooling covers the common cases.
What problem this solves
The worst way to learn your site is down is from a customer who couldn’t check out. Slow page loads are harder still – the site responds, but visitors leave before it finishes.
Without monitoring, you have no record of when a problem started or how often it recurs. SPanel’s website monitoring watches your hosted domains and records uptime, speed, TTFB, and slow-event counts, giving you both an alert and a history.
How SPanel solves this
Open Domains > Website Monitoring. The page lists the domains on your account with columns for Uptime, Average Speed, TTFB, Slow Events, and SSL Status, so you can scan every site’s health at once.
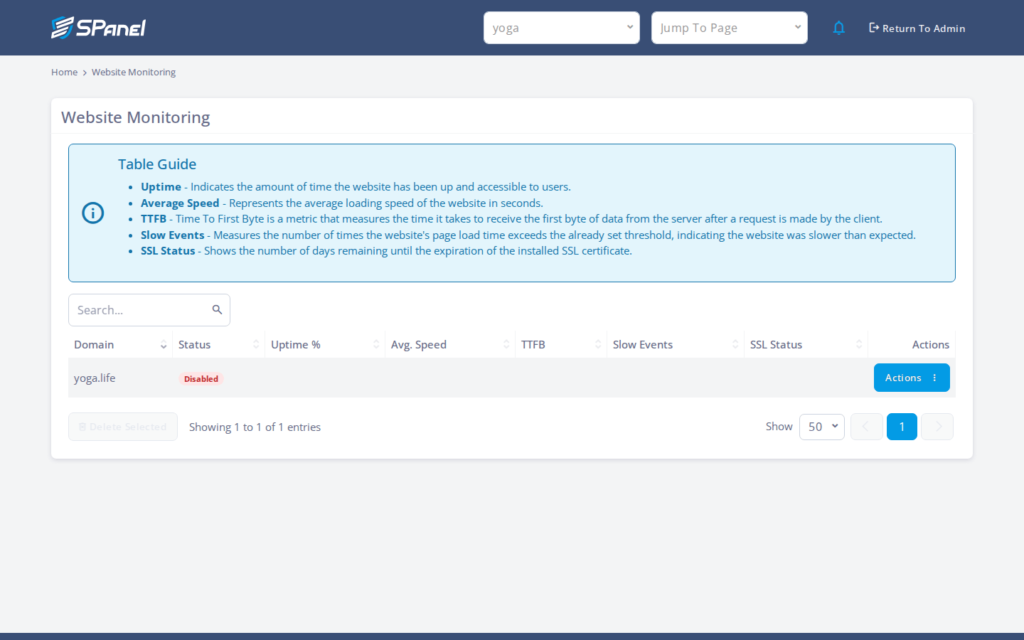
Each row has an Actions menu with Edit and History.
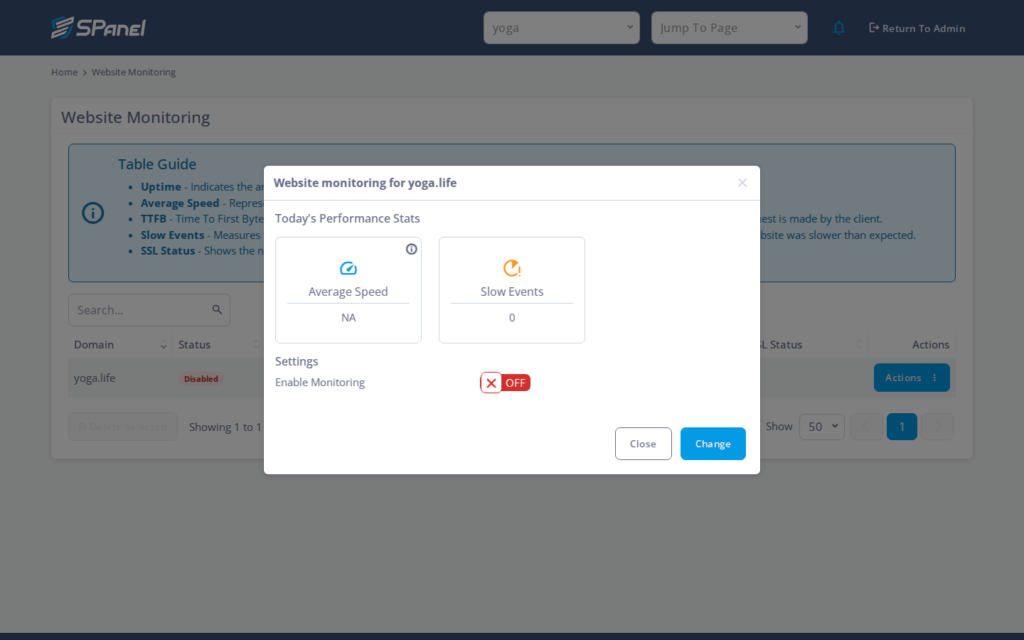
Edit opens a page titled “Website monitoring for ” showing today’s stats and a Settings section. In Settings, there is an Enable Monitoring ON/OFF toggle; set it and click Change to apply. The check interval and thresholds are not user-set in this UI.
Once monitoring is on, SPanel collects the metrics and the row reflects current status; alerts are delivered through SPanel’s Notifications Manager.
Why this is different in SPanel
Two things stand out.
First, monitoring is built into SPanel and routes through the same Notifications Manager as your other server alerts – no separate uptime service to sign up for or pay for.
Second, the page surfaces speed, TTFB, and slow-event counts per domain alongside up/down status, so you see performance degradation, not just hard outages. A site that is up but slowing under load shows in the same view you already use.
Before you start
- You need access to SPanel for the account that hosts the domain.
- The domain should be hosted on this ScalaHosting account.
- Confirm a notification channel is set in the Notifications Manager; without one, monitoring records data but cannot notify you.
- Enabling monitoring is not destructive – it only starts collecting data – so no backup is required first.
Step-by-step
- In SPanel, open Domains > Website Monitoring. You should see your domains listed with the Uptime, Average Speed, TTFB, Slow Events, and SSL Status columns.
- Find the domain you want to watch – in the screenshots, this is yoga.life – open its Actions menu, and choose Edit. The page “Website monitoring for” opens, showing today’s stats and a Settings section.
- In Settings, set the Enable Monitoring toggle to ON, then click Change to apply. The page confirms the setting, and the domain’s row on the main list reflects that monitoring is active.
- To review a domain’s record, return to the list, open the Actions menu, and choose History – useful for confirming a visitor-reported problem and seeing how often slow events occur.
What happens behind the scenes
After you enable monitoring, SPanel checks the site on a recurring cadence and records each result – whether it responded, how fast, its TTFB, and whether it crossed into a slow event. Because the checks are scheduled rather than continuous, there is a short gap between an outage starting and the system registering it. The payoff is a timestamped history plus alerts routed through the same Notifications Manager handling your other server notices.
Limitations and edge cases
- Monitoring covers domains hosted on this ScalaHosting account. Whether a fully external (off-server) domain can be monitored is not shown here. If you need to watch a domain hosted elsewhere, treat that as unconfirmed and check with support.
- Detection is on a polling cadence, so alerts are near-real-time rather than instant. For sites where seconds of downtime matter, pair this with a status check on your side.
- Alerts depend on a configured notification channel in the Notifications Manager. Without one, monitoring still records data, but you will not be notified – set the channel before relying on alerts.
Troubleshooting
| Symptom | Likely cause | What to do |
| Site went down but no alert arrived | No notification channel set in the Notifications Manager | Configure a channel, then confirm monitoring is ON for the domain |
| Domain not listed on the monitoring page | Domain is not hosted on this account, or is external | Confirm it is hosted here; external support is not available |
| Alert came minutes after the outage | Polling cadence, not instant detection | Expect near-real-time, not instant; this is by design |
| Monitoring shows OFF after editing | Change was not applied | Reopen Edit, set Enable Monitoring to ON, and click Change |
When to use this / when not to use this
| Use this when | Skip or use something else when |
| You host the domain on this ScalaHosting account | The domain is hosted entirely off-server |
| You want uptime plus speed and TTFB in one view | You need sub-second, instant outage detection |
| You want alerts through your existing Notifications Manager | You have no notification channel and won’t set one |
FAQ
Q: Does SPanel website monitoring cost extra?
A: No – it is built into SPanel and uses the Notifications Manager you already have, so there is no separate uptime service to buy. It covers only domains hosted on this account.
Q: How often does SPanel check my site?
A: Checks run on a polling cadence, so alerts are near-real-time rather than instant. The exact check interval is not user-set in this UI.
Q: Can I monitor a domain hosted somewhere else?
A: Monitoring covers domains on this ScalaHosting account. External domain names cannot be monitored through SPanel.
Q: Where do the alerts go?
A: Alerts are delivered through SPanel’s Notifications Manager. With no channel configured there, you will not receive notifications even when monitoring is on.
Q: What does TTFB tell me?
A: TTFB (time to first byte) reflects how long the server takes to start responding. Rising TTFB or slow-event counts can signal performance trouble before a full outage.
Q: How do I see past incidents?
A: Open the domain’s Actions menu and choose History for a timestamped record of problems and recurring slow events. Enabling monitoring is not destructive and needs no backup beforehand.